Stop Reading, Start Looking - Assessing Perceived Usability With Pictorial Scales
In 2017, I attended the uxcamp in Zurich, the Human Factors Conference in Rome and the AOW Conference in Dresden. At each event, I presented a topic from the University of Fribourg where I lead a second life as a researcher in the domain of cognitive ergonomics and work psychology. I spoke about our team’s development of pictorial scales which are a set of tools that can be used to gather user feedback and measure product usability.
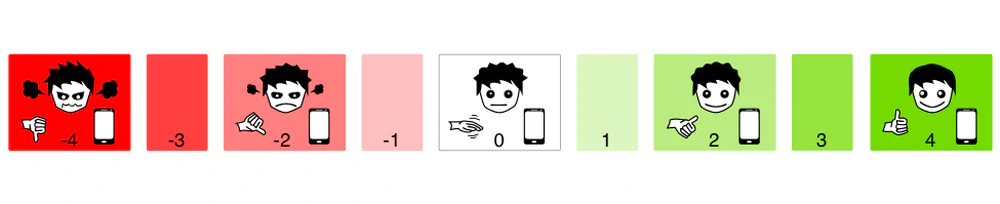
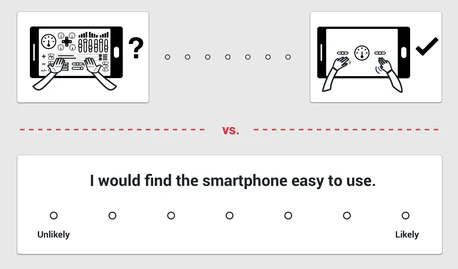
Product assessment questionnaires are commonly used to understand how an application is perceived by its users. They contain a text description, and users are asked to rate their impressions on a scale (e.g. “overall, I am satisfied with the application”). In our research, we show users pictograms of a specific usage situation rather than text and a rating scale from low to high intensity. The user then marks the position on the scale that matches their current impression of the application.
To assess our pictorial scales, we tested them in usability sessions with students. First results indicate that pictorial scales are effective. There is, however, a need to refine the pictograms in order to better convey their meaning.
There are a couple of advantages to pictorial scales: Users with problems in language comprehension or non-native speakers can be included in usability evaluations making evaluations relevant in an international context. Our data also shows that users find pictorial questionnaires more fun to fill out than text-based questionnaires (which are often tedious and time-consuming).
But, there are limitations to using pictorial scales, especially for complex topics. In order to deal with more complex topics, we may integrate fragments of text (keywords) to increase comprehensibility. A further option might be the use of animations to convey scale meaning. Pictorial scales are a promising endeavor and our research will definitively continue to explore their use.